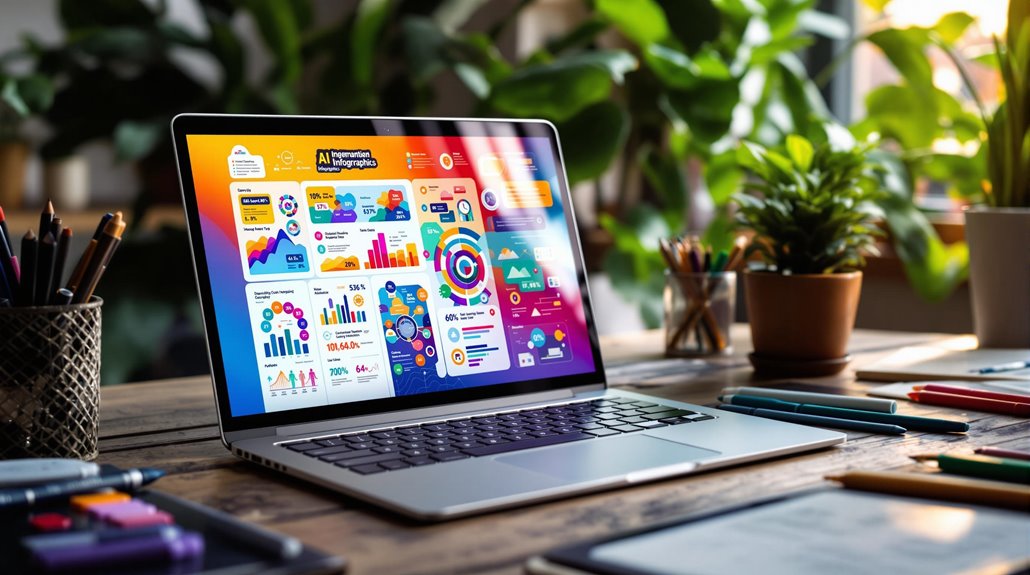
To create AI-generated infographics that perform well on Pinterest, start by using the ideal dimensions of 1000 x 1500 pixels, adhering to a 2:3 aspect ratio. Incorporate engaging content by defining your target audience and using relevant statistics, ensuring you credit sources. Leverage AI tools, such as Infogram, to assist in design and customization. Optimize your infographics with strategic keywords in titles, descriptions, and alt text for better discoverability. Regularly analyze engagement metrics using analytics tools like Tailwind to refine your approach. Following this guide will enable you to enhance the effectiveness of your infographics further.
Briefly keys
- Use AI tools to streamline infographic design, ensuring alignment with brand identity and optimized layouts for visual appeal.
- Incorporate relevant keywords and hashtags in titles and descriptions to enhance discoverability on Pinterest searches.
- Follow Pinterest’s ideal dimensions (1000 x 1500 pixels) and apply the 60-30-10 color rule for effective visual hierarchy.
- Regularly analyze engagement metrics to refine content strategies based on real-time performance data and audience preferences.
- Stay updated with trends using Pinterest Predicts, and incorporate bold, nostalgic, or eco-friendly aesthetics to attract user interest.
Choosing the Right Dimensions

When creating AI-generated infographics for Pinterest, selecting the right dimensions is vital for guaranteeing your visuals stand out. The ideal width for infographics is around 735 pixels, while the height can be flexible, adjusting according to the width. For standard Pins, the recommended height is 1500 pixels, adhering to a 2:3 aspect ratio.
However, for infographics, you might consider a longer height, such as 1000 x 3000 pixels, which corresponds to a 1:3 aspect ratio. Be mindful of truncation issues that can arise with this aspect ratio. Pinterest automatically resizes images wider than 735 pixels, which could disrupt your visual hierarchy and negatively impact image quality. This is especially important because truncated Pins negatively affect performance.
Consequently, it’s essential to guarantee that your images remain clear and legible, especially on mobile devices, where many users will view your content. The maximum file size for Pins is 20MB, and both PNG and JPEG formats are accepted.
Crafting Engaging Content
Crafting engaging content for your AI-generated infographics is essential for capturing your audience’s attention and conveying your message effectively. Start by defining your objective and audience; clarify the purpose of your infographic to guide your content strategy, ensuring it aligns with the interests and needs of your target demographic.
Identifying your key message is vital, as it shapes the content you present.
Next, organize and structure your content logically. Utilize an outline to enhance readability, categorizing information into clear subsections, which helps guide viewers through the infographic. Highlight key elements and support points to maintain clarity.
Gather relevant data that substantiates your concepts. Use accurate statistics, whether from original research or existing sources, and credit them appropriately. This not only bolsters your credibility but also makes your infographic more compelling. In addition, consider leveraging AI-driven design to create visually appealing layouts that enhance your data presentation.
Finally, leverage AI for customization and real-time content updates. Use AI to generate text and visual elements, ensuring your infographic remains current and engaging. By fine-tuning every detail, you’ll enhance audience engagement, ultimately creating a powerful tool that resonates with your viewers and achieves your objectives.
Designing Visually Appealing Infographics

Creating a visually appealing infographic is just as important as crafting engaging content. The design elements you choose can greatly enhance audience engagement, making your message more impactful. Infographics can effectively combine text and visuals, improving comprehension and retention of your message.
Here are four key strategies to reflect upon:
- Grid Design: Use a grid layout to create structure and graphic balance, guaranteeing that your content flows logically. This helps guide the viewer’s eyes naturally from one section to the next.
- Color Psychology: Select a consistent color scheme with 2-3 complementary colors. Apply the 60-30-10 rule to maintain visual balance—60% graphic elements, 30% text, and 10% negative space. Colors should evoke emotions and reinforce your brand without compromising text readability.
- Visual Hierarchy: Utilize size, color, and placement to emphasize important information. This strategy helps to highlight key points and keeps viewers focused on what matters most.
- Icon Selection: Incorporate high-quality icons and graphics that illustrate complex concepts. Confirm your visuals complement the text, enhancing clarity and supporting your overall message.
Leveraging AI Tools for Design
AI tools are revolutionizing the design process, making it easier than ever for you to produce stunning infographics. With AI design, you can streamline the entire workflow, as infographic automation simplifies the creation by suggesting layouts and content based on the data you input.
These generators allow you to transform raw data into polished infographics within seconds, eliminating the need for complicated design software. Moreover, over 30,000 companies utilize Infogram for data visualization, highlighting the tool’s effectiveness and popularity.
When you encounter creative blocks, AI tools can enhance your creativity by offering innovative layout and visual suggestions. They can condense lengthy paragraphs into concise bullet points and recommend visuals that align with your data. This not only boosts your infographic’s visual appeal but also guarantees clarity and effectiveness.
Additionally, these tools allow for customization, enabling you to align your infographics with your brand identity by adjusting colors, fonts, and other design elements. You can refine the AI-generated drafts to better match your vision.
Additionally, AI can turn blog posts or single keywords into branded infographics with just a few clicks, facilitating efficient content creation and wider distribution.
Adopt AI tools to elevate your infographic-making capabilities and produce professional-quality visuals effortlessly.
Optimizing Infographics for Search

Optimizing your infographics for search can greatly enhance their visibility on platforms like Pinterest. By focusing on keyword integration and clear descriptions, you can guarantee your content reaches a broader audience.
Here are four key strategies to implement:
- Conduct Keyword Research: Use the Pinterest search bar for auto-suggestions, and explore Pinterest Trends to discover popular search terms. Tools like Google Keyword Planner can also help you find relevant keywords.
- Add Keywords to Titles and Descriptions: Incorporate primary keywords in your title and early in the description. Use secondary keywords naturally, and include relevant hashtags to boost discoverability.
- Optimize Image Alt Text: Write descriptive alt text that accurately describes your infographic’s content. Include relevant keywords to enhance SEO, but keep it concise and informative. Data visualization techniques can significantly improve the presentation of complex information in your infographics.
- Organize Boards Effectively: Create SEO-friendly board names that feature relevant keywords, and organize your infographics into themed boards for better discoverability.
Regularly update your board content to maintain relevance.
Analyzing and Refining Performance
How can you guarantee your infographics are performing at their best? Start by tracking key engagement metrics, such as pins, likes, and repins. These metrics help you identify which elements contribute to your infographic’s success.
Utilize AI-powered analytics tools like Clicky and Tailwind to monitor impressions and click-through rates, providing you with valuable insights. The integration of advanced machine learning algorithms can further enhance your ad targeting and personalization efforts.
Next, identify which designs and keywords yield the best results, allowing for targeted content optimization in future posts. A/B testing different design elements, like color schemes and layouts, can reveal what attracts more interaction.
Regularly monitor your analytics and adjust your strategy based on real-time data; this iterative approach guarantees your content remains relevant and engaging.
Additionally, adopt a data-driven approach to refine your infographic content. Tweak visuals, fonts, and layouts based on performance data and focus on clear, singular points to keep your audience engaged.
Best Practices for Pinterest

Creating standout content on Pinterest requires a solid understanding of best practices that enhance both visibility and engagement. To effectively navigate Pinterest algorithms and boost audience engagement, consider these key strategies:
- Design Quality Pins: Use a 2:3 ratio for your pin dimensions, aiming for 1000 x 1500 pixels. Fresh images are essential; avoid overused visuals. Make certain your text overlay is clear and uses sans serif, bold fonts for better traction. Additionally, original content is prioritized by Pinterest, so focus on creating unique images that represent your brand.
- Diverse Formats: Experiment with various pin formats, including video pins, to capture attention. Repurpose content from other platforms, like Instagram, and create “fresh” pins for all your blog posts to keep your content lively.
- Enhance Infographics: Maintain a superior width of around 735 pixels for infographics. Use a limited color palette that aligns with your brand and make certain a logical flow, incorporating white space for readability.
- Effective Pinning Strategies: Pin only once to the most relevant board initially. Avoid frequent re-pinning of the same content; instead, schedule one fresh pin per link daily, using tools like Tailwind to maximize reach.
Staying Updated With Trends
Staying on top of Pinterest trends is crucial for designing content that resonates with your audience. One effective way to achieve this is by utilizing Pinterest Predicts, a trend forecasting report that boasts an impressive 80% accuracy rate. By analyzing user searches and planning behaviors, it allows you to anticipate upcoming trends, enabling informed content planning.
Historically, Pinterest has accurately predicted trends eight out of ten times, making it a reliable source for identifying key design elements. For 2025, bold, nostalgic, and sustainable aesthetics are emerging, with suggestions to integrate historical aesthetics like Rococo and medieval-inspired motifs. Incorporating these designs can greatly enhance your visual storytelling.
Using bold colors and mood-based palettes can increase engagement, while eco-friendly and minimalistic elements are gaining traction. To leverage these insights, crosscheck trends with your niche to discover relevant content ideas. Incorporate trending keywords and hashtags to improve your content’s discoverability. Additionally, make sure that your Pins include trending visuals, as this reinforces brand recognition. Pinterest serves as a search engine for planning future events, highlighting the importance of aligning your content with user interests. By integrating these trends into your content strategy, you can create compelling, AI-generated infographics that perform well on Pinterest and resonate with your target audience.
People are Asking
What Tools Can I Use to Create Infographics Quickly?
You can use design software like Piktochart and Venngage to create infographics quickly. They offer a variety of infographic templates, allowing you to customize and refine your designs with ease, even without prior experience.
How Can I Ensure My Infographic Is Shareable on Social Media?
Infographics with engaging visuals are shared 3 times more often. To guarantee yours is shareable, use compelling headlines, clear calls to action, and optimize for keywords. Consistent branding and strategic posting times boost visibility, too.
What File Formats Are Best for Pinterest Infographics?
For Pinterest infographics, use PNG for its advantages in quality, especially with text, while JPEG has limitations with detailed graphics. Both formats guarantee your visuals look great, so choose wisely based on your content needs.
How Often Should I Post New Infographics on Pinterest?
You should aim for a posting frequency of 1-3 new infographics daily. Monitor engagement metrics to see what resonates, and adjust your schedule based on audience activity to maintain strong interaction and visibility.
Can I Reuse Infographic Designs for Different Topics?
Yes, you can reuse infographic designs for different topics. With infographic customization, you’re leveraging design versatility, allowing you to adapt visuals while keeping your audience engaged and aligned with their interests and needs.
Wrapping up
By implementing these strategies for creating AI-generated infographics, you’re setting the stage for success on Pinterest. Envision your visually striking designs capturing attention, drawing in users who scroll through their feeds like leaves dancing in the wind. With the right dimensions, engaging content, and optimized visibility, your infographics can stand out amid the noise. Regularly analyze performance and adapt to trends, ensuring your creations not only inform but also inspire action, ultimately driving traffic and engagement.


